
How to Reduce Textile Waste in Global Sourcing 2026?
How to Reduce Textile Waste in Global Sourcing 2026? begins with a difficult question: where does waste enter the supply chain? It can appear during fiber production, fabric cutting, sampling, shipping, returns, and unsold inventory. In 2026, sourcing teams must measure each stage, not only final disposal. Fashion Revolution co-founder Orsola de Castro has said, “The most sustainable garment is the one already in your wardrobe.” Her statement challenges brands to produce with greater restraint.
A reliable textile waste strategy combines accurate demand forecasting, smaller test orders, and closer supplier collaboration. Buyers can compare fabric utilization rates before approving production. They can also review cutting-room scraps by weight, color, and fiber type. Digital product records may help trace materials from spinning mills to finished garments. However, technology cannot repair poor purchasing decisions. A dashboard is not a solution by itself.
Small changes matter.
A sourcing manager might adjust a pattern by two centimeters, saving hundreds of meters of fabric across a large order. Suppliers can separate cotton scraps from polyester scraps, improving reuse and recycling options. Brands should also measure return rates and unsold stock, because waste often continues after manufacturing. No global sourcing plan is perfect. Forecasts fail, trends change, and recycled materials may have quality limits. That reality deserves honest reporting, not polished claims. Progress depends on verified data, practical supplier training, and clear targets that teams review every season. Reducing textile waste is not merely an environmental promise. It is a purchasing discipline built through evidence, transparency, and repeated improvement.
Defining Textile Waste in Global Sourcing
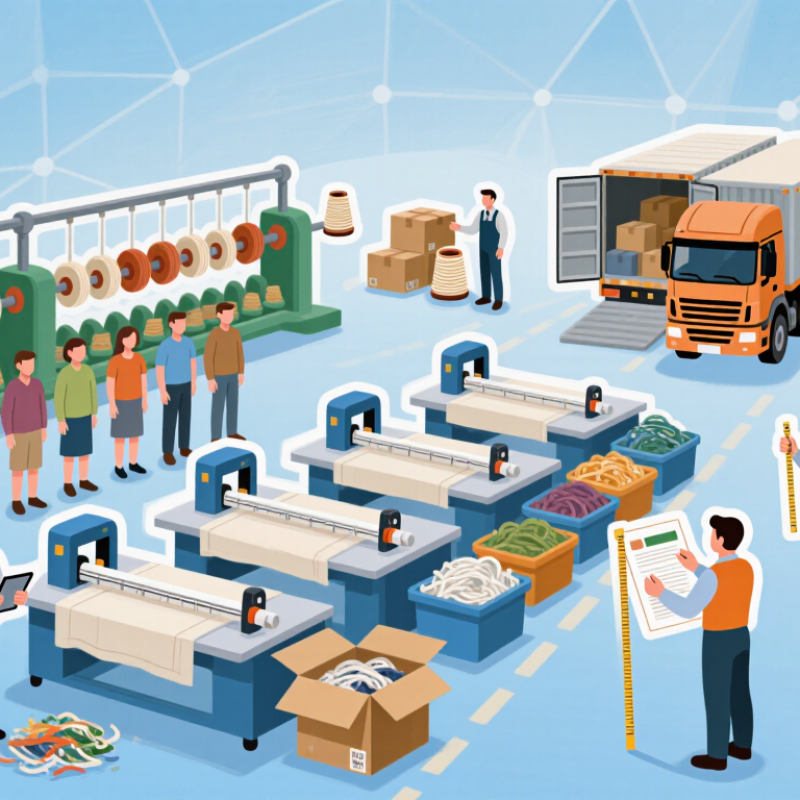
Textile waste in global sourcing means more than discarded garments. It includes fiber loss during spinning, yarn waste, cutting scraps, rejected fabric rolls, defective products, unused samples, and unsold inventory. Even packaging can become part of the sourcing footprint when it supports textile production and cannot be reused.
The clearest definition follows the material’s journey. A 200-kilogram fabric order may lose weight during spreading and cutting. Small offcuts collect beside cutting tables, while damaged rolls remain in storage. Production teams may also create extra units to cover quality risks. These units can become deadstock when demand changes. Waste can appear before a product reaches a customer.
Measurement requires practical records. Track fabric received, fabric consumed, cutting waste, rejected pieces, and finished goods separately. Supplier data should include production dates, material weights, defect causes, and disposal routes. In factory assessments, visual checks often reveal waste that spreadsheets miss. A full bin tells a different story than a percentage report.
The process is rarely perfect. Suppliers may estimate waste instead of weighing it. Different facilities may also use different definitions. That weakens comparisons across countries. Buyers should question unusual figures, request evidence, and review the same records over time. A simple photograph of a cutting room can expose gaps between policy and daily practice.
Mapping Waste Across the International Textile Supply Chain
How to Reduce Textile Waste in Global Sourcing 2026?
Mapping Waste Across the International Textile Supply Chain
Waste rarely begins at the factory gate. It starts with fiber losses, yarn breaks, rejected rolls, and surplus inventory. Textile Exchange’s 2024 Materials Market Report estimates global fiber production reached 124 million tonnes in 2023. That volume makes small process losses financially significant.
A sourcing team should map waste at every handoff. Weigh fibers before spinning, record yarn waste, and inspect dye-house sludge and wastewater treatment residues.
At the cutting table, photograph unused fabric strips beside the marker plan. Dyeing can also create shade rejects when laboratory approvals do not match bulk production.
UNEP reports that textiles generate 2–8% of global greenhouse gas emissions and consume about 215 trillion liters of water annually. These figures connect waste with climate and water risks.
The map must continue beyond production. Track damaged cartons, cancelled orders, returns, unsold goods, and post-consumer collection. The European Environment Agency reports that EU textile consumption reached about 6.0 million tonnes in 2020, while collection and recycling systems remained uneven.
Data quality is still imperfect. Suppliers may measure cutting scraps carefully but estimate wastewater solids. That gap needs disclosure, not concealment.
Use mass-balance records, shared definitions, and site-level evidence before setting reduction targets.
A spreadsheet cannot replace a factory walk. Stand beside the cutting machine. Watch the discarded edges accumulate.
Designing Smarter Material Selection and Production Plans
Material selection starts before a purchase order is issued. Build a fiber library for every product category. Record recycled content, fiber length, shrinkage, color limits, and expected yield. Keep physical swatches beside digital specifications. Suppliers should provide test reports, production capacity, and traceability records. Paper claims are not enough. Request recent evidence from the actual production site. Small changes matter.
Production plans should connect demand forecasts with cutting-room reality. Use demand ranges instead of one fixed sales estimate. Reserve flexible capacity for uncertain colors and sizes. Plan marker layouts before confirming fabric quantities. Better layouts can reduce offcuts without changing the design. Cutting teams should weigh daily waste and photograph unusual losses. Schedule dyeing and finishing in compatible batches. Short runs often create more waste than expected.
Reliable sourcing also needs measurable reviews. Track fabric utilization, rejected meters, rework hours, and leftover inventory by supplier. Review these figures after each production cycle, not only at year-end. An experienced sourcing team can compare material performance with commercial risk. However, efficiency targets can create pressure for unsafe shortcuts or weaker quality. That risk deserves open discussion. Sometimes a slightly heavier fabric lasts longer and reduces replacement demand. The calculation is imperfect. Record the assumption, test it, and revise the plan when evidence changes.
How to Reduce Textile Waste in Global Sourcing 2026? - Designing Smarter Material Selection and Production Plans
| Material / Product Area | Typical Pre-Consumer Cutting Waste* | 2026 Planning Target | Smarter Material Selection | Production Planning Action | Recommended KPI |
|---|---|---|---|---|---|
| Woven cotton shirts | 12–20% | ≤12% | Use stable-width fabric and standardize compatible colorways across styles. | Approve digital marker layouts before bulk cutting; combine compatible orders. | Marker efficiency ≥88%; cutting waste kg per 100 garments. |
| Knitted jersey garments | 8–15% | ≤10% | Prioritize tubular or optimized-width fabric when it meets fit and quality requirements. | Use graded digital patterns and limit unnecessary size or color fragmentation. | Marker efficiency ≥90%; fabric utilization by style and size. |
| Denim trousers | 12–20% | ≤14% | Select consistent fabric width and reserve cutting remnants for pocketing or smaller components. | Plan nesting by size ratio and use remnant cutting plans before opening new rolls. | Remnant recovery ≥30%; kilograms of denim sent to disposal. |
| Polyester woven outerwear | 8–15% | ≤10% | Prefer recycled content with verified chain-of-custody data and avoid unnecessary mixed-fiber constructions. | Forecast demand by channel and postpone final color allocation where feasible. | Unsold finished-goods rate <2%; recycled-content share by product weight. |
| Wool and wool-blend tailoring | 10–18% | ≤13% | Use recyclable trims and minimize fiber blends that complicate future recycling. | Cut high-value panels first and allocate smaller components to verified remnant programs. | High-value material recovery ≥90%; trim and offcut separation rate. |
| Printed or patterned fabrics | 15–25% | ≤17% | Choose engineered prints and repeat sizes that reduce mismatch between garment panels. | Validate pattern placement digitally and purchase a controlled test quantity before bulk production. | Print-related waste reduction ≥15%; rejected panels per 1,000 units. |
| Accessories and small components | 5–15% | ≤8% | Standardize labels, tapes, cords, and trims across product families where performance allows. | Create a shared component library and set minimum order quantities against confirmed demand. | Component obsolescence <1%; unused trim inventory by season. |
| Sampling and development | Variable | ≥50% fewer physical samples | Use digital materials libraries, 3D prototyping, and color standards before physical sampling. | Require approval gates for fit, construction, and color before producing the next sample round. | Physical samples per style; sample fabric reused or recovered. |
| Low-volume or uncertain-demand orders | Demand-dependent | Pilot before scale-up | Select materials available in flexible lot sizes and avoid irreversible treatments until demand is validated. | Use small-batch production, reorder points, and postponement of final finishing where practical. | Forecast error by SKU; end-of-season stock rate <5%. |
| Factory cutting-room operations | Process-dependent | 100% measured by order | Require fabric-width, roll-length, defect-map, and marker-efficiency data before production release. | Weigh incoming fabric, usable panels, reusable remnants, and disposal separately for every purchase order. | Material balance variance ≤2%; traceable waste records for every order. |
Reference framework: The table is aligned with publicly documented textile circularity principles from the United Nations Environment Programme, the European Environment Agency, the European Commission’s Ecodesign for Sustainable Products Regulation, and standard cutting-room material-balance practices. No company or brand-specific data is included.
Implementing Reuse, Recycling, and Return Systems
In global sourcing, textile waste often begins before production. Excess fabric, cutting scraps, and returned garments can accumulate across several countries. A practical waste plan needs clear material records. Suppliers should report fabric composition, unused stock, and monthly disposal volumes. These figures help purchasing teams identify avoidable waste instead of relying on estimates. Small changes matter. Adjusting order quantities can prevent thousands of unwanted units.
Reuse systems should come before recycling whenever quality allows. Unused fabric can support future orders, sampling, repairs, or packaging inserts. Returned garments need careful inspection at a regional sorting point. Items in good condition can re-enter sales channels or serve as approved samples. Damaged products may become cleaning cloths, insulation, or recycled fiber. Each decision should be recorded with weight, destination, and handling date. This creates a traceable chain of custody.
Our first return trial was not efficient. Collection boxes filled unevenly, and several suppliers used different material labels. We corrected the process with standard forms, color-coded bins, and quarterly supplier reviews. Still, recycling rates can look better on paper than in practice. Blended fabrics remain difficult to separate, and transport can reduce environmental benefits. Teams should measure recovery costs, emissions, and actual reuse rates. Honest reporting builds stronger sourcing decisions, even when results are disappointing.
Measuring Waste Reduction and Improving Sourcing Performance
Reducing textile waste in global sourcing requires measurable targets, not attractive promises. UNEP estimates that the fashion industry creates 92 million tonnes of textile waste each year. Its production also generates up to 8% of global greenhouse gas emissions. These figures make waste a sourcing-performance issue, not only an environmental concern.
Buyers can track waste at each stage: fabric cutting, sampling, defects, returns, and unsold inventory. A practical dashboard should report kilograms of waste per finished garment, usable fabric percentage, rework hours, and recycled-input share. The European Environment Agency reported that EU consumers generated about 6.95 million tonnes of textile waste in 2020, or 16 kilograms per person. Suppliers should verify these numbers through production records, weighing scales, and periodic third-party checks. Estimates are convenient. They are also often wrong.
Tips: Set a quarterly waste baseline. Compare factories by product type, not only total volume. Review marker efficiency before placing large orders. Photograph full waste bins during audits. Keep rejected materials separate from reusable remnants. Reward lower waste only when quality remains stable. A small defect rate can erase impressive savings.
Global sourcing teams should connect waste data with delivery reliability, fabric utilization, and cost per accepted unit. This reveals hidden performance. For example, a cheaper supplier may create more cutting waste and rework. Textile Exchange’s Materials Market Report also shows continued growth in recycled-fiber use, but recycled content alone does not prove waste prevention. Sourcing decisions need traceable data, practical factory experience, and regular reassessment. Not every improvement lasts. That is the uncomfortable part.
Related Posts
-
Top 10 Solutions for Reducing Textile Waste in Supply Chains?
-

2026 Best Fabric Weaving Machine Options for Quality Production?
-

What Are the Best Home Textile Trends for Global Buyers?
-

2026 How to Master Fabric Weaving Techniques for Beginners?
-

Best Fabrics for Every Project You Need to Know?
-

How to Source Quality Italian Fabric for Your Business?